NASA's PACE satellite tracks fall foliage colour worldwide
NASA's PACE satellite maps fall leaf colour across the planet every day or two. How its hyperspectral OCI sensor sees reds and yellows, and how you can help.
LandGadget Newsroom · · 3 min read
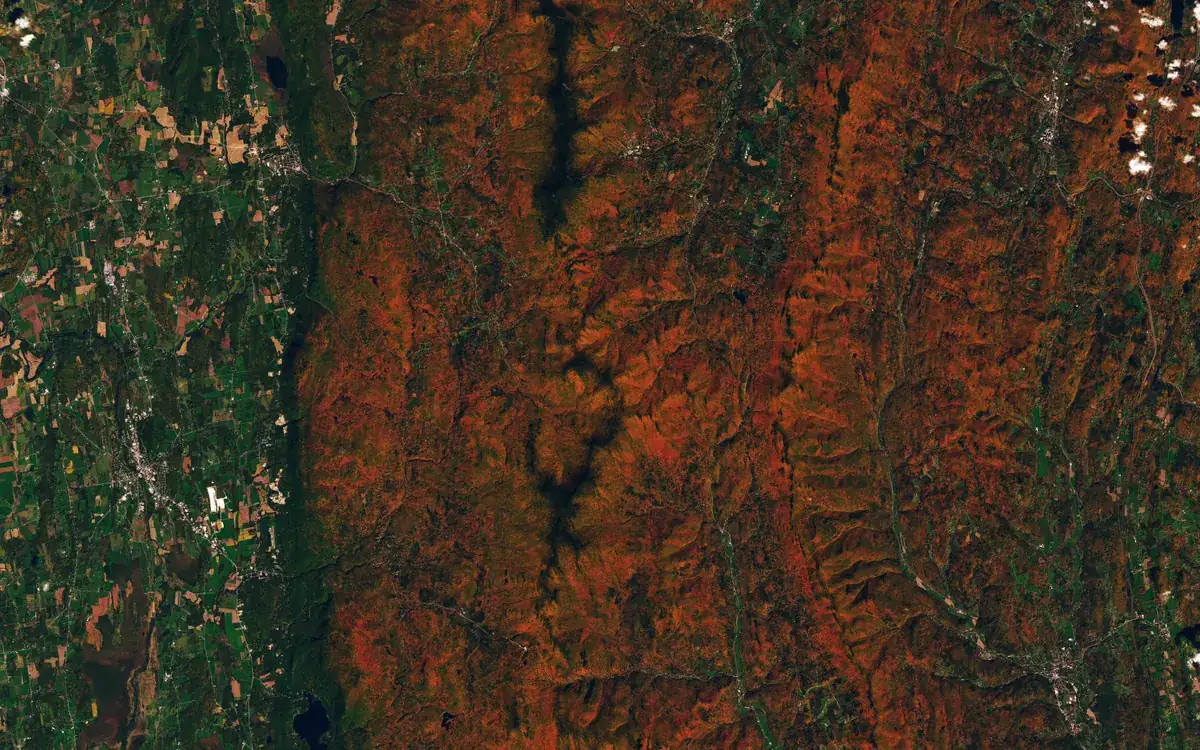
Leaf-peeping now has a satellite. NASA's Earth Observatory has published maps of autumn colour made with the PACE (Plankton, Aerosol, Cloud, ocean Ecosystem) mission, showing where leaves are turning red around the world and when colour peaks, as described in its Image of the Day for 26 October.
How a satellite sees red leaves
PACE carries the Ocean Color Instrument (OCI), a hyperspectral sensor that observes oceans and vegetation daily in 286 spectral bands. A few groups of those wavelengths respond to the pigments that drive fall colour:
- anthocyanins, the reds;
- carotenoids, the yellows and oranges;
- chlorophylls, the greens.
Scientists compare how much red, orange and yellow a forest shows against green. A value near 1 means the satellite sees about as much red as green and most leaves have not turned; higher values mean more red pigment. Tracking that ratio over time reveals when colour peaks in any place.
Other hyperspectral satellites can do something similar, but only over small areas and less often. NASA says PACE is the first satellite able to measure all three pigments across the entire planet every day or two. "It's the ability to collect time-series data of anthocyanins and carotenoids everywhere on Earth repeatedly that is game-changing," said PACE science team member Karl Huemmrich.
What the 2026 maps show
Between 29 September and 4 October, redness was highest in parts of northern and eastern Russia, northern Alaska and northern Canada, and red foliage peaked in New England. From 5 to 11 October the colour moved toward the equator, across the US Midwest and Mid-Atlantic, Mongolia and northern China, while New England began to fade.
The strongest reds in the US Northeast come from sugar maples and red maples; in Arctic tundra, blueberries, bilberries, sedges and mosses likely add to the signal. The cover image, from Landsat 9 on 3 October, shows red ridges around Ripton, Vermont. Not every red patch is autumn: harvested crops and drought- or insect-stressed plants can also show high anthocyanin levels.
Why it matters, and how to help
Beyond pretty maps, scientists hope the data will show how the timing of spring green-up and autumn is shifting, how vegetation affects the carbon cycle and wildfire risk, and whether PACE can spot early signs of drought, pests or disease. The team is asking the public to send ground photos through GLOBE's North America Phenology Campaign to check the satellite readings. As NASA's Skye Caplan put it, colour changes happen "kind of slowly, then all at once, and then they're gone."
NASA's satellites are mapping the planet in other new ways too: read how CASALS lidar could build 3D maps of Earth. Want to capture the season yourself? Our night sky phone photography guide has tips that also help with low-light landscapes.
Frequently asked questions
Can satellites see fall foliage?
Yes. NASA's PACE satellite measures leaf pigments from orbit and can map where leaves are turning red or yellow across the whole planet every day or two.
Where can I see the NASA fall colour maps?
NASA Earth Observatory published them on 26 October 2026, and NASA's Skye Caplan posts weekly foliage maps as part of the GLOBE North America Phenology Campaign.
More from Science & Space
View all →Read next

Lidar vs cameras for self-driving cars: which is better?
Lidar vs cameras vs radar: how each self-driving sensor works, why Tesla uses cameras only while Waymo, Mercedes and the Rivian R2 add lidar, and what it means.

Dispatch hits iPhone and Android Dec 9, four episodes free
AdHoc Studio's superhero comedy Dispatch launches on iOS, Android and Google Play Games on PC on December 9: first four episodes free, full game $19.99.
How to turn off smart TV tracking (ACR) on any brand
Step-by-step menu paths to switch off ACR and ad tracking on Samsung, LG, Vizio, Roku, Sony and Fire TV, plus why taking the TV offline is the surest fix.